Article
Consolidating scattered equipment data into a single operating system

FMS Connecting Power, HVAC, Environment, and Safety Facilities
The More Facilities There Are, the More Complex Operations Become
Various facilities and control systems already exist on site. Switchboards and Power Meters manage power status, DDC and BMS handle HVAC, fire receivers monitor disaster prevention events, and PLCs and WCS oversee automation equipment. While each system performs its role well, operators must navigate multiple screens and piece together disparate alarms and metrics.
The problem is that the normal status of individual equipment alone cannot explain the overall operational state. When the temperature on a specific floor rises, it is difficult to determine from a single screen whether the cause is an indoor unit, a shared outdoor unit, the HVAC main distribution board, an open door, or a sensor error. Even if conveyor throughput drops, operators must independently verify which point is responsible among the Motor, VFD, Sensor, PLC, power supply, or Queue.
As facility data becomes scattered across multiple systems and it becomes difficult to link how failures impact spaces and operations, the need for a Facility Management System (FMS) has emerged. An FMS does not unconditionally replace existing control systems. Instead, it receives data from each facility, organizes it under a unified asset hierarchy and time axis, and connects it so operators can make decisions all at once.
Key Shift in Operational Perspective |
A Single Operational Model Created by FMS
The basic workflow of an FMS extends from field facilities to the control layer, collection layer, data layer, and operation screen. It utilizes existing control points—such as Power Meters, UPSs, HVAC Controllers, fire receivers, and PLCs—and deploys RTUs or Gateways where needed. The collected values are stored along with equipment names, locations, criticalities, and relationships, and are utilized for alarms, trends, reports, and analytics.
FMS Adds an Operational Perspective on Top of Existing Systems
System | Primary Role | Typical Targets |
FMS | Integrated monitoring and operational analysis of facilities and equipment | Power, HVAC, environment, safety, automation |
BMS | Centralized control and scheduled operation of building facilities | HVAC, lighting, DDC, select electrical systems |
SCADA | Real-time monitoring and control of industrial and utility facilities | PLC, processes, power, pumps/valves |
EMS | Energy consumption and efficiency management | kW, kWh, Peak, cost, carbon |
DCIM | Data center physical infrastructure and capacity management | Racks, UPS, PDU, cooling, IT assets |
WMS/WCS | Logistics operations and automation flow management | Inventory, work orders, Conveyor, Sorter |
FMS is not a system designed to eliminate BMS or SCADA. BMS excels at HVAC operation and control, while SCADA and PLCs are responsible for fast control cycles and safety logic. WMS/WCS understand orders and logistics flow. FMS gathers necessary data from these systems and reconnects them from the perspective of facilities and operations.
· Control can retain the safety logic of existing PLCs, DDCs, and BMSs, while FMS can be designed around read-only data collection as a default.
· Equipment capable of direct integration is collected via standard protocols, while sections relying on contact points, serial connections, or proprietary protocols are supplemented with RTUs or Gateways.
· Even for the same event, impacts on facilities, spaces, and operations must be displayed together to determine action priorities.
Path of Facility Data to the FMS
Layer | Representative Components | Role |
1. Field | Sensors, meters, motors, circuit breakers | Generates temperature, power, contact status, and operating states. |
2. Control | PLC, DDC, Power Meter, fire receiver, ACP | Organizes field signals into control information and equipment status. |
3. Collection | FMS AP, RTU, Protocol Gateway | Executes protocol collection, unit conversion, buffering, and communication fault monitoring. |
4. Data | PG, VM, CH, or Time-Series DB | Stores configuration information, events, performance, trends, and statistics. |
5. Operation | Web Dashboard, mobile alerts, reports | Provides operators with current status, failure impact, and action priorities. |
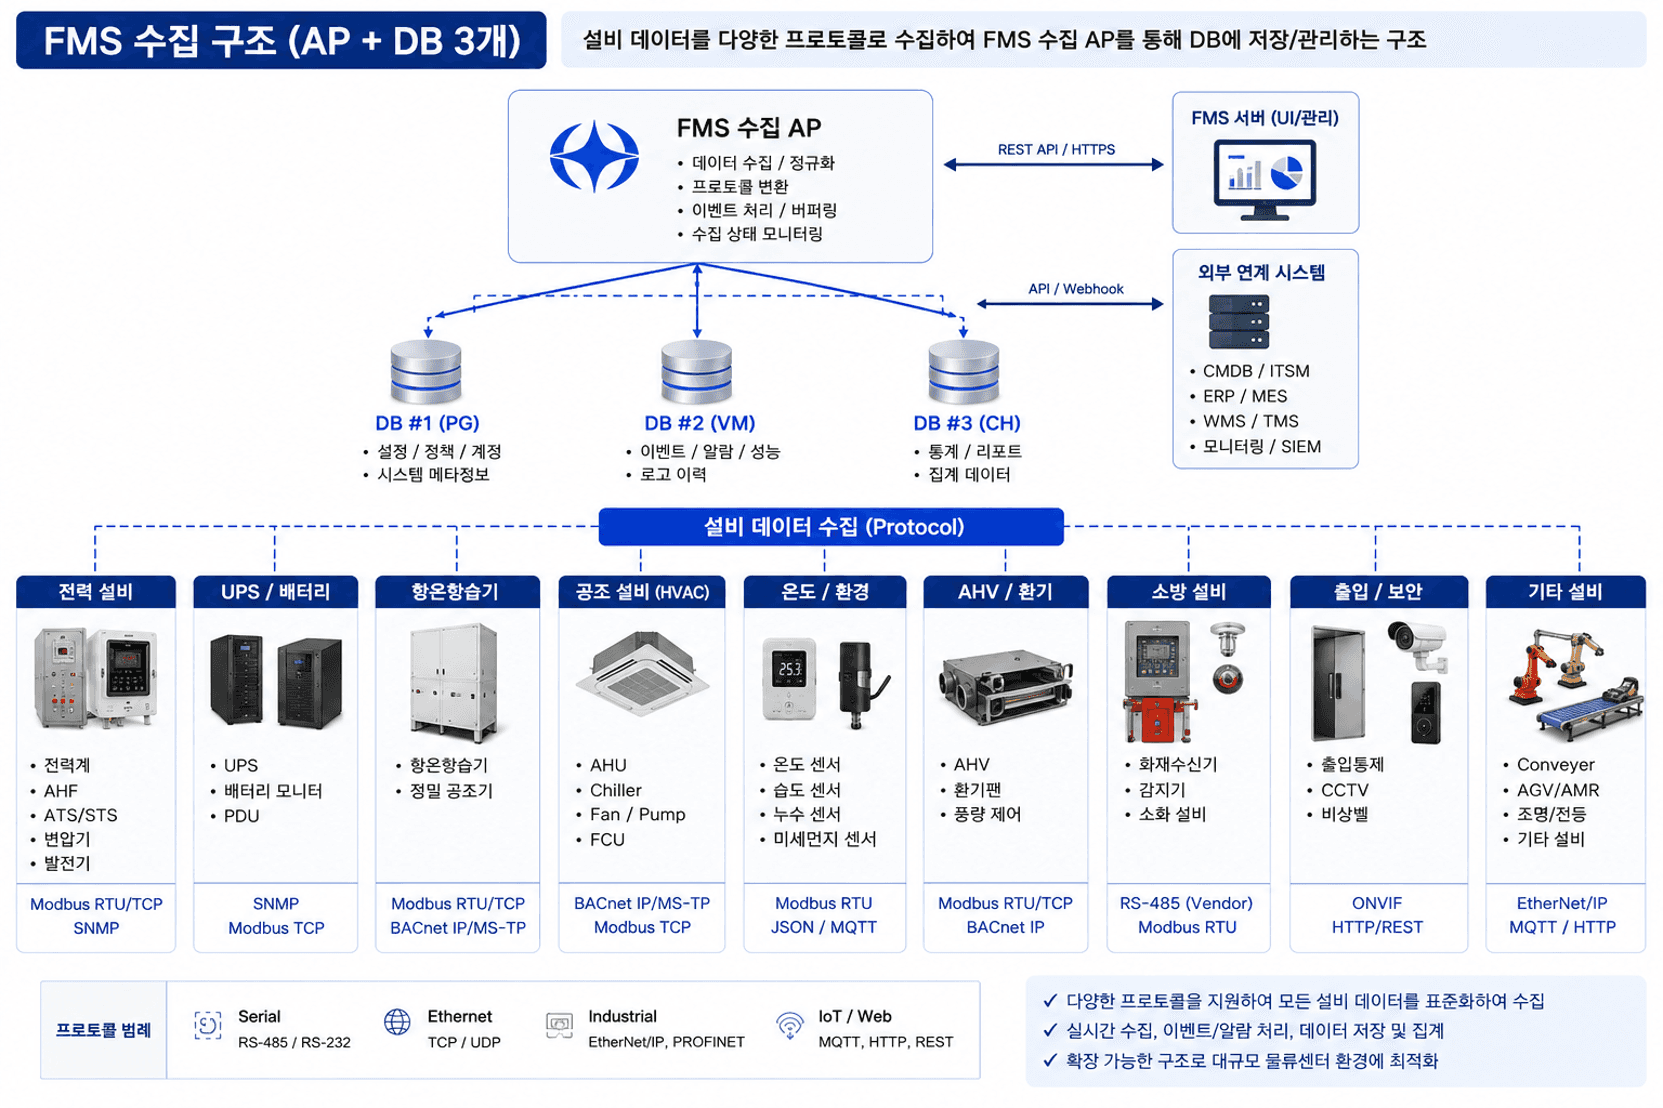
Example of integrating facility data centered around the FMS collection AP and data layer
Direct Collection and Relay Collection Are Used Together
Collection Method | Representative Examples | Application Significance |
Direct Collection | SNMP for UPS, BACnet/IP for BMS, OPC UA for PLC, API for NVR | Simple architecture that can leverage standard equipment features |
RTU Collection | Modbus RTU power meters, contact-type water leak/door sensors, 4–20mA sensors | Aggregates distributed field signals and transmits via TCP/IP |
Gateway Collection | Proprietary PLC protocols, vendor serial, protocol conversion | Connects sections lacking standard interfaces to higher-level systems |
Understanding Protocols Clarifies the Collection Architecture
In facility monitoring, protocols must be distinguished from physical transmission methods. Modbus RTU typically operates over RS-485 Serial, whereas Modbus TCP uses TCP/IP over Ethernet. BACnet is also divided into BACnet/IP and BACnet MS/TP, while SNMP is widely used in UPSs, PDUs, and network equipment.
Protocol | Transmission Method | Primary Facilities | Characteristics |
Modbus RTU | RS-485 / RS-232 | Power meters, AHF, generators, ATS, sensors | Register-based, simple and universal |
Modbus TCP | Ethernet / TCP | Power Meters, PLCs, Gateways, UPS | Modbus data collection across IP networks |
BACnet/IP | Ethernet / UDP | BMS, DDC, AHU, Chiller, HVAC | Object-based building automation standard |
BACnet MS/TP | RS-485 | DDC, HVAC Controller, sensors | Field BACnet Serial network |
SNMP | Ethernet / UDP | UPS, PDU, RTU, Switch, Server | Collects status, performance, and Trap events |
OPC UA | Ethernet / TCP | PLC, SCADA, logistics automation | Integrates tags and events in a vendor-neutral manner |
REST API / MQTT | HTTPS / TCP | NVR, WCS, AGV, IoT Platform | Integration with higher-level systems, cloud, and events |
DI/DO · AI | Dry contact / 4–20mA / 0–10V | Water leak, door, fire, pressure/flow sensors | Collects digital and analog signals via RTU/PLC |
Communication Ports Alone Are Not Enough |
How Power and Power Quality Are Read
A distribution panel itself does not generate power data. A Power Meter installed within the panel receives CT and voltage signals to calculate voltage, current, active power, energy consumption, power factor, frequency, and more. Distribution panels without a Power Meter can establish metering points by adding CTs and Digital Power Meters.
For Peak and load factor, Demand values provided by meters can be used, or the FMS can store time-series data to calculate daily, weekly, and monthly maximums as well as utilization rates relative to rated capacities. In power quality, reviewing an AHF's THD-V, THD-I, TDD, compensation status, and Faults together is necessary to distinguish harmonic reduction efficacy from equipment anomalies.

Configuration example of collecting distribution panel Power Meter and AHF data via RTU/FMS

Target | Key Metrics | Operational Significance |
Distribution Panel / Power Meter | V, A, kW, kWh, PF, Hz, Demand, Peak, load factor | Overload, voltage abnormality, and energy consumption analysis |
AHF | THD-V, THD-I, TDD, compensation current, Run/Stop, Fault, internal temperature | Distinguishes harmonic reduction efficacy from equipment anomalies |
UPS / PDU | Input/output voltage and current, load factor, Battery, Bypass, Runtime | Verifies stability of uninterruptible power supplies and downstream loads |
Generator / ATS | Operating status, Source, voltage/frequency, fuel, transfer status | Confirms emergency power transfer procedures during outages |
Precision Climate Control (CRAC) Facility Monitoring
Precision climate control units are utilized in electrical rooms, telecom rooms, server rooms, and critical equipment areas requiring tighter temperature and humidity regulation than standard HVAC systems. Rather than merely displaying current temperature and humidity, one must evaluate deviations from setpoints, Compressor/Fan operating states, humidification/dehumidification status, runtimes, cycle counts, and recurring alarms together to assess control performance and maintenance requirements.
Example of key statuses and control metrics for precision climate control units
Metric / Calculation | Formula or Evaluation Criteria | Operational Application |
Temperature Deviation | Current Temperature - Set Temperature | Verifies cooling/heating control performance and sensor anomalies |
Humidity Deviation | Current Humidity - Set Humidity | Verifies humidification/dehumidification performance and condensation risk |
Supply/Return ΔT | Return Air Temperature - Supply Air Temperature | Tracks heat exchange and cooling capacity trends |
Runtime / Start Count | Cumulative Compressor/Fan hours and Start Count | Analyzes preventive maintenance cycles and short cycling |
Availability | (Normal Operating Time / Total Operating Time) × 100 | Evaluates reliability of environmental maintenance in critical spaces |
Condensation and Water Leak Risk Monitoring
It is advisable to manage condensation and water leaks separately from the perspective of facility protection rather than working environments. Condensation risk is assessed by comparing surface temperatures of distribution panels, ducts, and piping with the Dew Point calculated from ambient air temperature and relative humidity. The FMS manages the difference between surface temperature and dew point as the Condensation Margin, confirming actual moisture presence in conjunction with condensation/leak sensors or Leak Cable Events.
Recommended Derived Metric |

Example of calculating dew point and condensation risk using temperature, humidity, and surface temperature
Working Environment and Temperature/Humidity Monitoring
Working environment monitoring focuses on measuring space conditions. The Heat Index calculated from temperature and relative humidity is valuable for comparing heatwave working conditions against HVAC operational efficacy. Incorporating CO₂, particulate matter, and airflow provides a more comprehensive assessment of environmental quality across zones. When air velocity, mean radiant temperature, clothing insulation, and metabolic rate are captured, evaluations can expand to thermal comfort indices such as PMV and PPD.
Derived Metric | Input Data | Application |
Heat Index | Temperature + Relative Humidity | Compares heatwave working environments with cooling efficacy |
Dew Point | Temperature + Relative Humidity | Temperature at which airborne moisture begins to condense |
Condensation Margin | Surface Temperature - Dew Point | Early assessment of condensation risk on panels, ducts, and pipes |
Temperature/Humidity Deviation | Current Value - Setpoint | Checks CRAC unit control performance and sensor anomalies |
Supply/Return ΔT | Return Air Temperature - Supply Air Temperature | Verifies trends in HVAC heat exchange and cooling capacity |
PMV / PPD | Temperature, humidity, airflow, radiant temperature, clothing insulation, metabolic rate | Assesses comprehensive thermal comfort and predicted percentage of dissatisfied |

Example of calculating thermal comfort indices using composite environmental data such as temperature, humidity, and airflow
HVAC and Cooling Facility Monitoring
HVAC monitoring involves more than just checking the operating state of a single indoor unit. In VRF/multi-split air conditioning setups, IDU, ODU, PI485, ACP, and TMS (Total Maintenance System) must be examined collectively, while in central plant HVAC systems, AHUs, Chillers, FCUs, and Fans/Pumps should be analyzed as a unified cooling circuit.
The ACP aggregates the statuses of multiple indoor and outdoor units, while on-site TMS manages remote maintenance, faults, and operation histories. If the TMS offers external APIs or standard interfaces, it can integrate into the FMS through them; otherwise, the BACnet/IP or Modbus TCP interfaces of the ACP are leveraged directly. For environments without an ACP/TMS, dedicated collection paths utilizing PI485 and LG Modbus Gateways are considered.

Example of HVAC data integration depending on the presence of ACP and TMS
Target | Key Metrics | Operational Significance |
IDU | Run/Stop, Mode, room temperature, setpoint, airflow rate, Filter, Error | Monitors zoned cooling conditions and working environments |
ODU | Operating state, compressor/fan, outdoor temperature, capacity, defrost, Error | Determines shared refrigerant loop status and impact scope on multiple IDUs |
ACP/TMS | Connected unit count, comm status, operation/error history, remote diagnostics status | Verifies normal collection of centralized control and maintenance data |
AHU/Chiller | Supply/return air temperature, valves, Fan/Pump, chilled water temp, pressure, Fault | Monitors heat source and air distribution in central HVAC systems |
Environmental Sensors | Temperature, RH, CO₂, particulate matter, Heat Index | Analyzes working conditions, ventilation, and cooling efficacy |
Integrated Monitoring Encompassing Logistics Automation Facilities
In distribution centers, stoppages of Conveyors and Sorters extend beyond facility failures to shipment delays. Photo Sensors, Jam Sensors, Encoders, Motors, VFDs, and E-Stops connect to PLCs, which handle rapid control loops and safety logic. The FMS collects status and operational KPIs from the PLC or WCS in a read-only manner, analyzing them in tandem with facility data.
The FMS does not need deep, direct access to PROFINET or EtherNet/IP control traffic. Where possible, it uses the PLC's OPC UA or Modbus TCP interfaces, or an Industrial Gateway as a boundary, thereby protecting control network stability and isolating fault domains.

Example of integrated monitoring for automated facilities connecting Conveyors, PLCs, Gateways, and FMS
Perspective | Key Metrics | Operational Significance |
Line/Zone | Run/Stop, Line Speed, Queue, Jam | Monitors line operation status and bottleneck sections |
Motor/VFD | Current, frequency, RPM, Overload, Fault Code | Analyzes drive unit anomalies and causes of stoppages |
Sensor | Photo/Jam/Proximity status, Count, communication status | Checks material flow and sensor malfunctions |
PLC/Safety | CPU Run, Program Fault, E-Stop, Safety Relay | Verifies control layer and safety conditions |
Operational KPIs | Throughput, Availability, MTBF, MTTR | Translates facility downtime into logistics operational impact |
From Alarms to Root Causes and Impacts
The value of an FMS does not lie merely in reducing the number of alarms. It lies in correlating events across different facilities by time, location, electrical circuits, HVAC loops, and automation lines to explain "what happened first and how far does its impact reach."
Symptom | Investigation Flow | Operational Interpretation |
3F High Temperature | IDU stop → Shared ODU Error → HVAC Main power → Door open → Sensor error | Concurrently evaluates HVAC, power, and environmental factors behind zone temperature rise |
Conveyor Throughput Drop | Jam Sensor → VFD overcurrent → Motor Overload → PLC Fault → Power quality | Analyzes correlation between equipment downtime and logistics queue buildup |
Power Peak Surge | Automation utilization rate → HVAC load → Time-of-use power → Outdoor temperature | Identifies root causes of peaks and optimizes operational schedules |
Fire Event | AI CAM/NVR → Fire receiver → Zone → Adjacent electrical/automation facilities | Filters false alarms, identifies impacted zones, and guides evacuation and shutdown scopes |
Prerequisites for Event Correlation Analysis |
Distinguishing Communication Failures from Facility Failures
A disruption in data collection does not necessarily indicate that equipment has stopped. An FMS must distinguish between Equipment Faults, Controller Faults, Network Down events, Polling Timeouts, and data quality degradation. Without this distinction, actual equipment downtime and monitoring blind spots end up being treated as the same alarm.
Configuring a Distribution Center into a Single Site Topology
The example below shows a conceptual diagram representing the facilities of a logistics center featuring five floors and basement mechanical/electrical rooms as a single Site Topology. Rooftop outdoor HVAC units and cooling towers, operational floor FCUs, CRAC units, temperature/humidity sensors, smoke/heat detectors, sprinklers, and conveyors are connected in spatial and system relationships with switchboards, UPSs, AHFs, generators, service pumps, fire pumps, PDUs/RPPs, and battery systems located on the 1st floor and basement.
The objective is not to convert every field facility to the same protocol. The essence lies in accommodating BACnet/IP, Modbus RTU/TCP, SNMP, OPC UA, DI/AI, and APIs according to equipment characteristics, and standardizing data supplied by ACPs, TMSs, DDCs, PLCs, RTUs, and Gateways into the FMS asset model.

Example of integrated logistics center FMS monitoring representing power, HVAC, environment, safety, and automation together
Modeling Dimension | Included Facilities | FMS Representation |
Space | Rooftop, work zones, equipment rooms, electrical rooms, mechanical rooms, automation lines | Displays exact location and impacted area of facility events |
Power | Switchboards, UPS, generators, AHF, PDU/RPP, batteries | Power flow, Peak, power quality, emergency power status |
HVAC / Environment | HVAC, ACP/TMS, AHU, CRAC units, temp/RH, CO₂, water leaks, condensation | Analyzes working and equipment environments concurrently |
Safety | Fire receivers, smoke/heat/flame detectors, sprinklers, fire pumps, doors | Connects detection through fire protection activation and countermeasure execution |
Automation | Conveyors, Sorters, PLCs, VFDs, Sensors | Correlates equipment operation with throughput, jams, and failure histories |
Prediction and Optimization Driven by Time-Series Data
When power, temperature, humidity, harmonics, operating states, faults, and throughput accumulate along a timeline in the FMS, operations can progress beyond simple threshold monitoring to pattern comparison. By learning baseline operating ranges for each unit and observing changes across multiple metrics simultaneously, operators can detect anomalies earlier and establish maintenance priorities.
Extension Domain | Analytical Content | Application |
Anomaly Detection | Detects deviations in current, temperature, and operating states from normal patterns | Captures early variations that fixed thresholds miss |
Predictive Maintenance | Analyzes motor current, vibration, temperature, and fault patterns | Plans inspections and part replacements prior to failure |
Peak Forecasting | Combines time periods, workload, outdoor temperature, and HVAC loads | Manages contract capacity overruns and energy costs |
Condensation Risk | Analyzes Dew Point, surface temperatures, and water leak events | Preemptively identifies condensation hazards around panels and ducts |
Root Cause | Correlates power, HVAC, network, and automation events | Consolidates redundant alarms centered around root-cause equipment |
Operational Optimization | Compares throughput, environment, and power metrics collectively | Balances cooling performance against energy consumption |
Operational Dashboards Must Answer Questions
Rather than listing equipment types, the landing screen should answer: "Can the facility operate normally right now?" The top section places Site Health, Critical Alarms, Power/Peak, HVAC Normal Rate, Automation Utilization Rate, and High-Risk Environmental Zones. The center illustrates relationships between floors, zones, lines, and facilities. The bottom connects Trends, Alarm Timelines, MTBF/MTTR, and Energy Analytics.
Screen Area | Displayed Content |
Top KPIs | Site Health, Critical Alarms, Current Power, Peak, HVAC/Automation normal operational rates |
Space / Topology | Floors, zones, lines, electrical circuits, HVAC loops, equipment connectivity |
Trends | Power, THD/TDD, temperature/humidity, throughput, utilization rate |
Events | Occurrence/acknowledgment/resolution time, Severity, assignee, affected equipment |
Analytics | Candidate causes, recurring failures, MTBF/MTTR, AI Insights |
Polestar FMS Dashboard Examples


Conclusion
The starting point of facility monitoring is not about gathering massive volumes of data. It begins with defining which facilities support which spaces and operations, and then selecting data that can explain those relationships. When power, HVAC, environment, safety, and automation are unified into a single Site Topology, alarms cease to be mere numbers and become the foundation for operational decision-making.
An FMS is not a system intended to force disparate protocols into one standard. It accommodates Modbus, BACnet, SNMP, OPC UA, APIs, and DI/AI tailored to each piece of equipment, balancing direct collection with RTUs and Gateways. Time-series data accumulated this way can be expanded into anomaly detection, predictive maintenance, peak forecasting, and energy optimization.
Ultimately, the purpose of an FMS does not stop at observing equipment. It helps operators determine more quickly and accurately whether facilities are operating stably, where a failure originated, what operations it impacts, and what needs to be inspected next.
References
· Modbus Organization — Modbus Application Protocol Specification
· ASHRAE Standard 135 — BACnet, A Data Communication Protocol for Building Automation and Control Networks
· OPC Foundation — OPC Unified Architecture Specifications
· IETF RFC 3411–3418 — SNMP Architecture and Protocols
· LG Electronics / Maintenance Operation Materials — Installation and integration documentation for ACP, PI485, TMS, and Modbus Gateway
· NOAA/NWS — Heat Index Calculation
· ASHRAE Handbook — Dew Point and Condensation Fundamentals
Author: DW Jang | Nkia R&D Center


