DASHBOARD

Get a grasp of
operational data at a glance
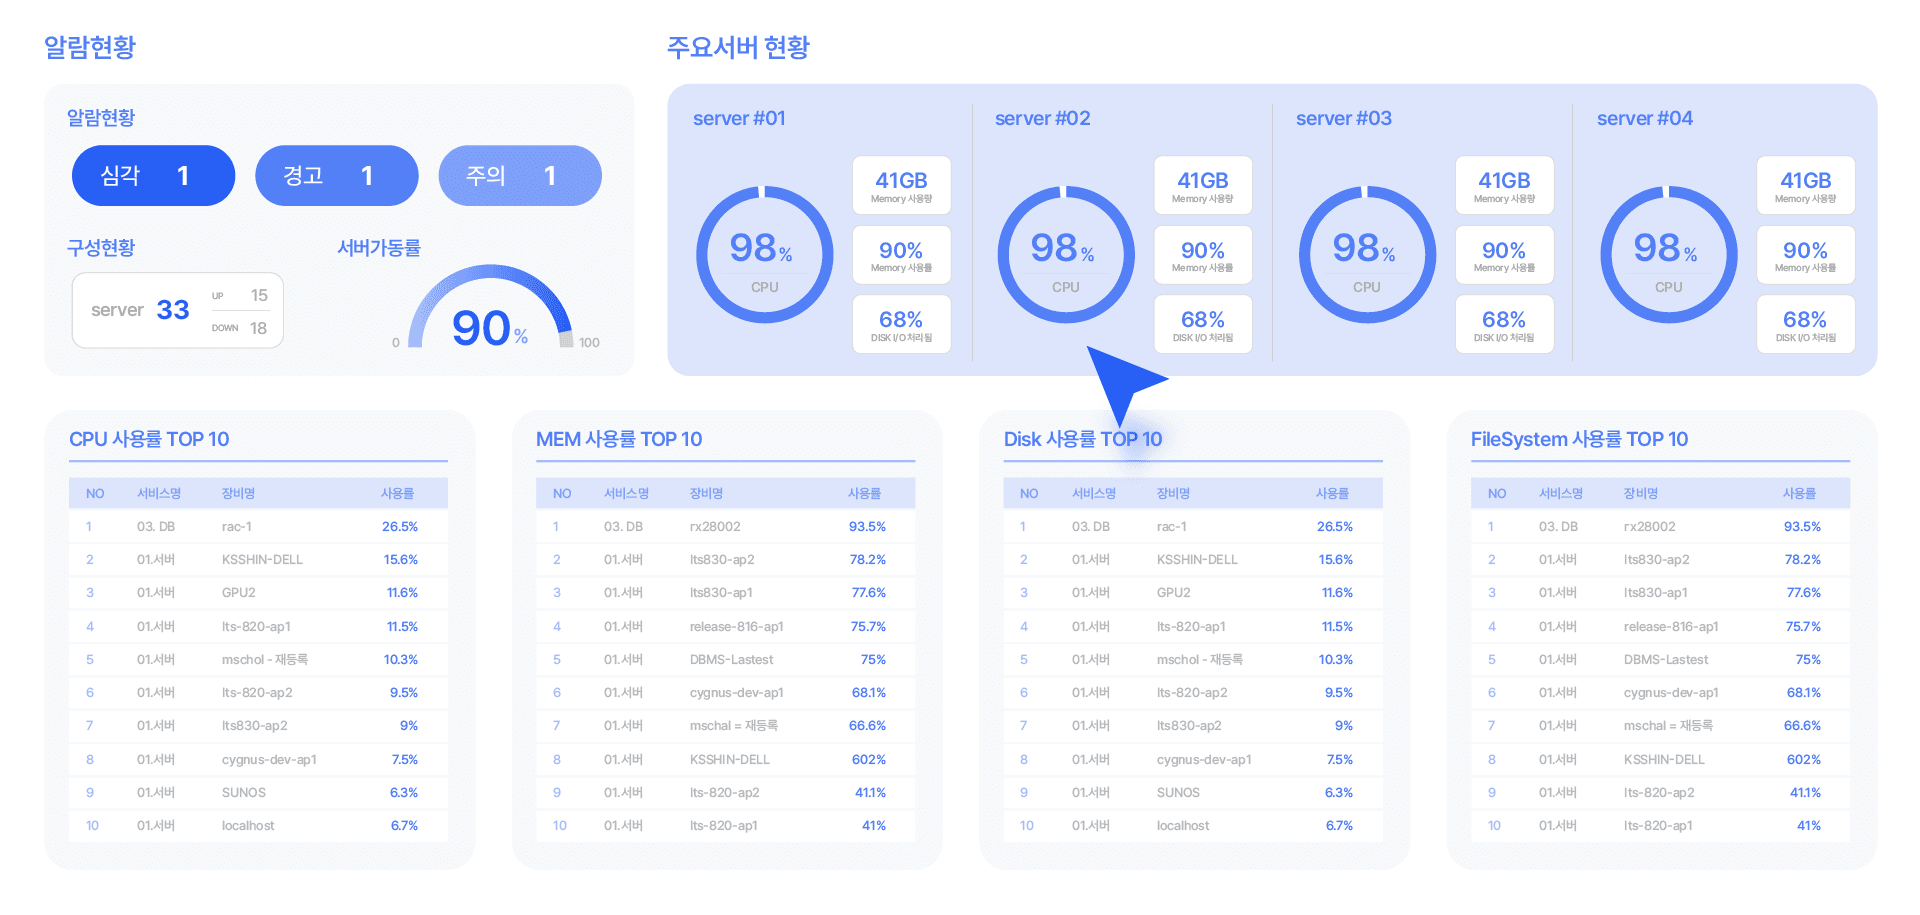
By integrating and visualizing decentralized operational data, you can

intuitively understand and quickly respond to the entire IT environment.

By integrating and visualizing decentralized operational data,

you can intuitively understand the entire IT environment

and respond quickly.

Overview

Integrated IT Visualization

Polestar 10 Dashboard is a dashboard solution that integrates and visualizes

various operational data such as servers, networks, applications, and databases on a single screen

to provide an intuitive understanding of the overall IT operational status.

Polestar 10 Dashboard is a dashboard solution that

integrates and visualizes various operational data such as servers, networks,

applications, and databases on a single screen,

allowing users to intuitively understand

the overall IT operational status.

AI dashboard interface for Nexum app

Key Features

Dashboard Features

Integrated Data Visualization

Integrated visualization of various operational data in a single dashboard

Provides real-time monitoring screen

Enable immediate situational awareness by monitoring key metrics in real time

User-customized dashboard configuration

Configure a personalized dashboard by selecting only the information you need

Product Experience

Intuitive operational visibility
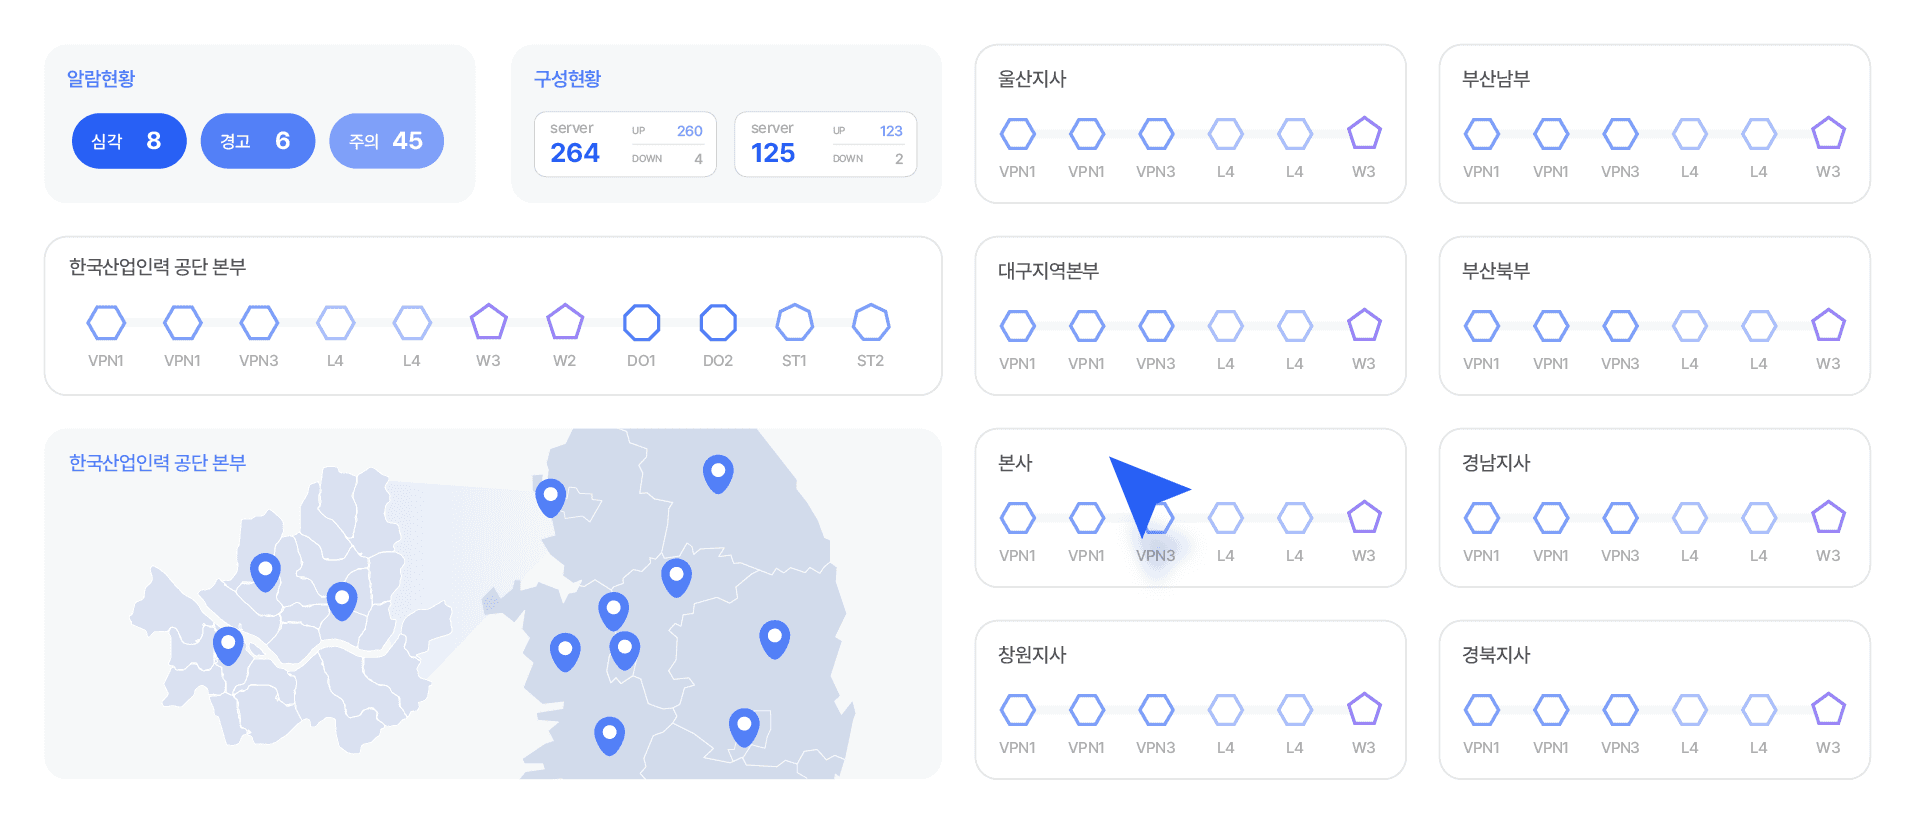
You can intuitively monitor the overall IT operations status on a single screen, and quickly identify and respond to situations when problems arise.

See your entire IT operations status on a single screen,

intuitively check, and when problems arise, quickly

understand and respond to the situation.

AI dashboard interface for Nexum app

Benefits

Why You Should Choose
an Integrated Dashboard

Maximize Operational Visibility

Get a complete view of your IT status at a glance

Providing a personalized experience

Role-specific optimized screen layouts

Support for fast decision-making

Enables intuitive, data-driven decision-making